
Understanding the Yield Curve
An inverted yield curve indicating a severe market crash seems to be a forgotten news item recently. But it did create a lot of waves and some fear when it was hitting the headlines of financial newspapers, less than a year ago.
Not being the hot topic in the news does not diminish the message behind the analysis of several experienced commentators. While not entirely subscribing to the doomsday analysis, this writer being a more passionate student of the fix-income market than other asset classes, we do not question it. Bubbles can grow very large before bursting, even in the light of economic indications to the contrary.
The “inverted yield curve,” occurs when the interest rates on short-term bonds are higher than the interest rates on long-term bonds. It indicates that people are concerned about the near-term and are buying into long-term investments, which restricts short-term availability of money. An inverted yield curve is also called a “negative yield curve”.

Significance and Interpretation of the Yield Curve
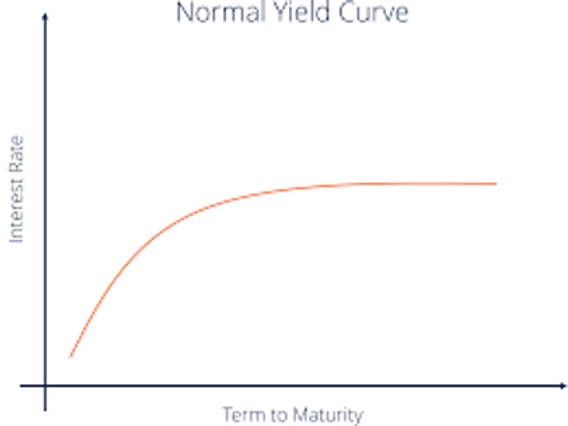
This normal yield curve is a reflection of the investor psyche and an economy in normal times. There is a liquidity discount, which means that any money in the pocket, or which can be accessed at very short notice earns nothing, or a lower rate of return. In a bank, this would be the lowest rate offered, as in a current account which pays no interest, and savings bank account paying a low rate. As the term increases rates normally rise. An investor expects a higher return for long term investments to compensate for the greater risk that accompanies time involved. These risks include, but may not be limited to the risk of default (the best business may fail due to changes in laws, customer preferences, business cycles, and other factors influenced by time), inflation (which is directly and quickly reflected in interest rates), and the ability to use the money at the current point in time.
After rising in the early parts of the curve, the yield curve tends to flatten out. To consider the Indian G-Sec yield curve, the early part of the tenure represents MIBOR (the Mumbai Inter-Bank Offered Rate) and the Reserve Bank of India’s reverse repo and repo (more on this in a later blog) which act as a sort of support, or lowest level of interest rates in the institutional economy. Only our own demand accounts (that is current and savings accounts with banks) have lower rates. These rates rise with time and tend to level out after 10 or 15 years. The 10-year G-Sec is a benchmark for the economy and is widely traded. Beyond 15 years, going on to the 30 years segment is less liquid and is loved by insurance firms. A life insurer provides protection for very long tenures and prudently covers the risk by grabbing and holding on to safe securities that take a very long time to mature.
A yield curve with any shape tells enough stories that forecast the economy that can actually fill a little book. Studying that curve helps investment decisions not just in the fixed-income market.


 Allow Retail Investors to Access Corporate Debt Markets?")


